
Maryland’s $1.4* Billion Price Tag to Pilot Competitive Energy
Maryland’s residential retail energy market took off in 2010 after Maryland’s Public Service Commission (PSC) approved Utility Consolidated Billing with purchase of receivables (POR).
By 2013, 28% of Maryland residential accounts had switched from their regulated utility’s supply rates to a competitive retail supplier’s offer.
“UCB and POR” required Maryland’s five larger, regulated utilities to include and print third-party supplier charges on residential utility bills. Regulated utilities were also responsible for third-party charges billing, collections, and account terminations. If third-party supplier customers didn’t pay, third-party suppliers still got paid.
A 2018 Abell Foundation Report, cowritten by Arjun Makhijani, Ph.D. and Laurel Peltier, made the case that utility POR, when combined with variable rates that had no oversight or caps, was a key driver in Maryland’s sky-high retail supplier rates (pg. 8 in report).
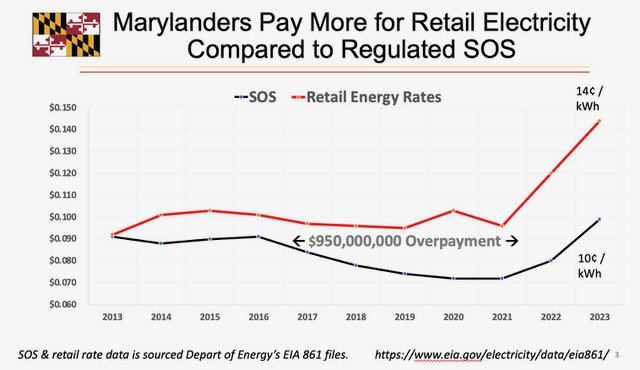
On average, Maryland retail energy families paid higher power bills. See chart below.
Even after the 2018 Abell Foundation report detailed Maryland’s dysfunctional market, retail suppliers continued to increase electricity and gas third-party supplier prices (see historical chart below).
In 2021, days after Texas’ Uri storm, The Wall Street Journal published two investigative articles diving into Texas’ $28 billion electricity overpays and the Northeast states’ $19 billion losses to regulated electric rates. Baltimore families are prominently featured in the 2nd article.
In 2022, an extensive UC Berkeley Haas report was published that relied on Maryland BGE utility retail energy billing data. The report asked: Why low-income retail energy accounts paid more than higher income accounts? The 108-page analysis laid out how retail supplier pricing discrimination focused on low-income, immigrant, and communities of color ZIP codes. In short, the report’s title explained the key reason billions have been lost, retail suppliers compete for residential customer’s “inattention.”
In 2023, based on increasing PSC retail energy consumer complaints, the PSC launched a maximum enforcement effort demanding that retail suppliers improve their business and sales practices. By 2023, Maryland residential retail energy consumers had spent $1.2 billion more than if they had stayed with their regulated utilities’ default electricity and gas rates.
By 2023, residential retail supplier market share had dropped from 28% to 13% . High third-party energy rates and aggressive sales tactics didn’t promote a healthy business market.
The back drop to Maryland’s steadily increasing retail supplier rates was that starting in 2020, Maryland’s regulated default energy rates were rising due to PJM grid supply/demand imbalances (Virginia data centers loads, increased utility delivery rates, higher grid transmission rates and dinosaur coal plant closures).
Maryland’s residential retail energy market wasn’t working.
Residential consumers had higher retail energy power bills. The initial deregulatory 1999 Electric Choice Act‘s goal was to “provide economic benefits for all customer classes.” While residential retail energy customers paid more, in 2024 90% of Maryland’s Commercial accounts were serviced by third-party energy supply. Commercial and Industrial customers in 2024 paid $650 million less for electricity supply than if they were serviced by Maryland’s regulated utilities. (EIA861 data)
Maryland passed SB31/HB397 in 2021 capping retail energy rates for accounts on state energy assistance. Maryland passed SB1 in May 2024.
SB1 became effective on January 1, 2025. The law required suppliers to charge no more than the average of the previous 12 months’ average default rates. SB1 also eliminated purchases of receivables. “Green” energy offers are required to be reviewed by the Public Service Commission and offers backed by RECs can charge rates above regulated default rates.
Retail energy suppliers have made no new offers for energy assistance (LIHEAP) accounts since July 1, 2023. Retail energy suppliers have made no new offers for all Maryland customer since 1/1/25.
In 2026, Maryland’s General Assembly HB1532 increased the rate cap to 110% or lower than regulated rates for 36-month contracts.
Please review the charts below for supporting data:
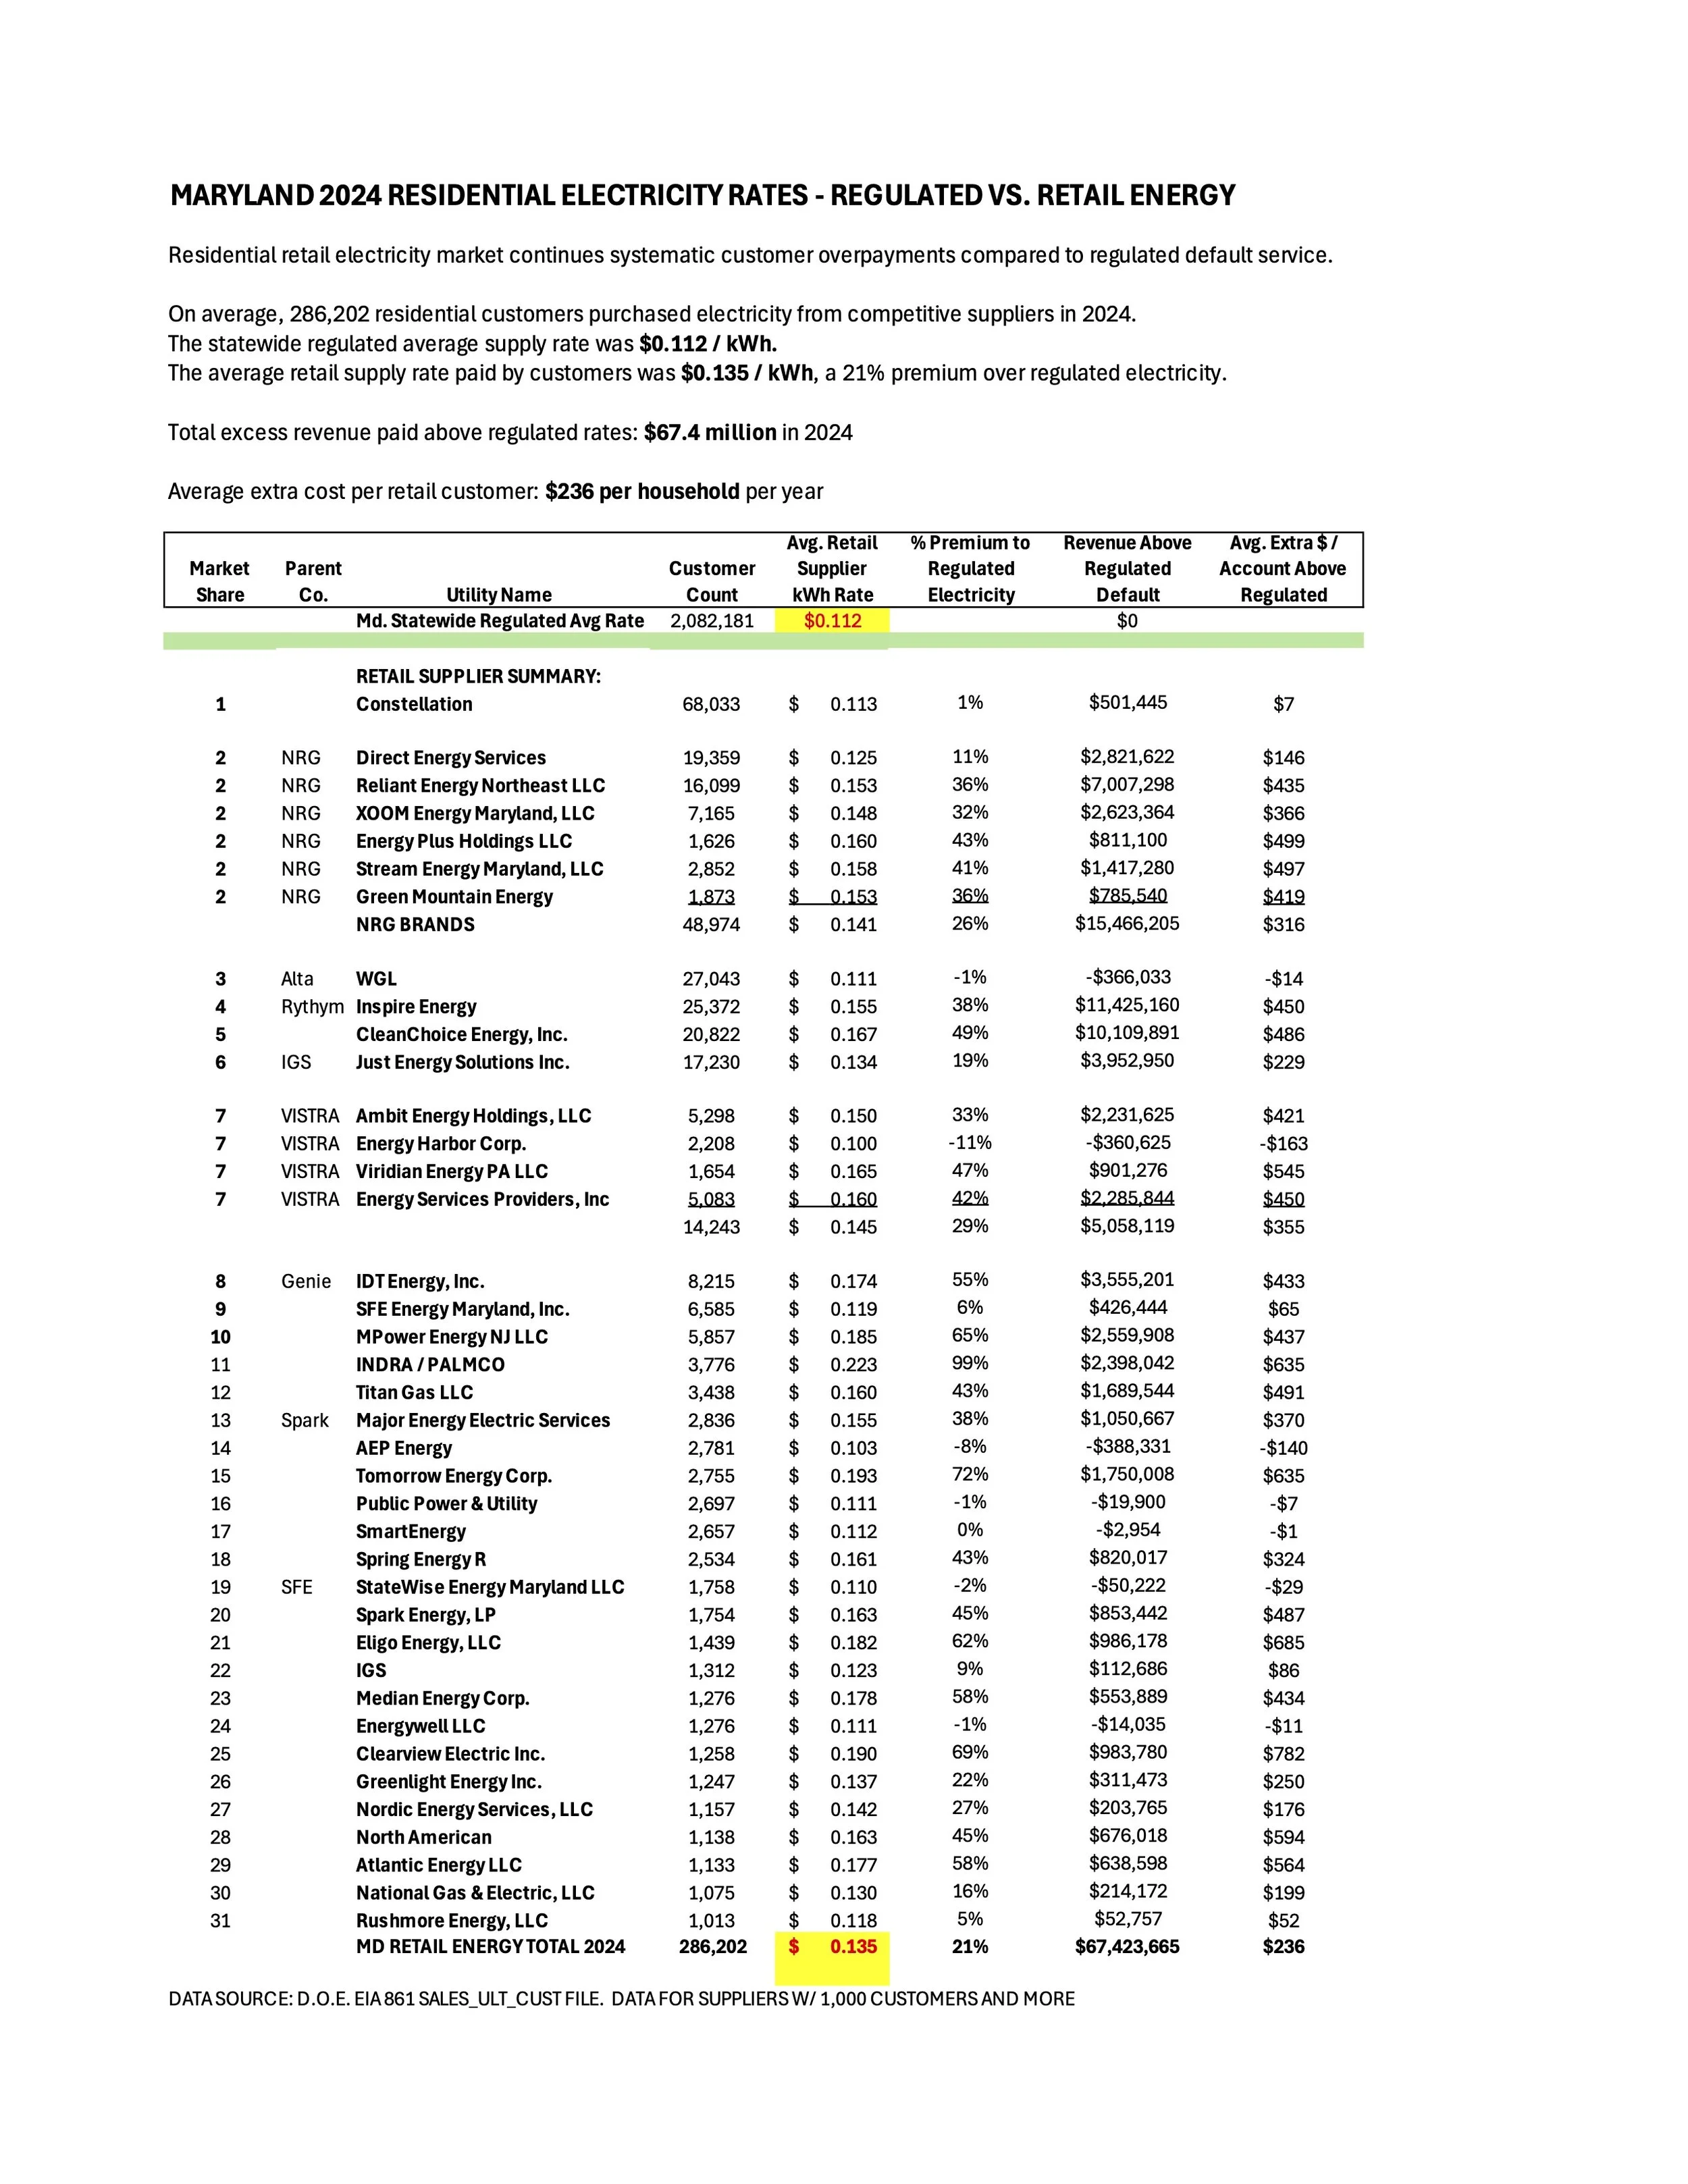
1) 2023 and 2024 market analysis by supplier compared to regulated electricity rates.
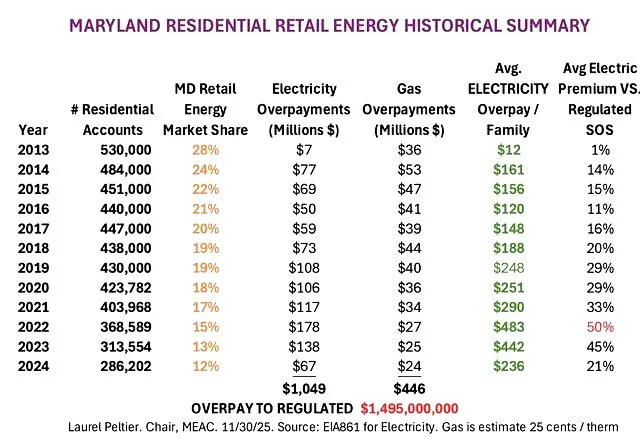
2) Residential retail energy market historical rates, # of accounts, and overpayments since 2013.

* Maryland’s total ratepayer price tag to pilot retail energy is much higher than $1.5 BILLION
Excluded from the $1.5 billion price tag is:
The significant ratepayer-funded IT costs for 5 regulated utilities to execute UCB, POR, sales and drops, customer calls, the sales feeds between supplier salesmen and utility databases. Might run into half a billion dollars. No one knows.
Significant Maryland PSC and OPC legal costs to fight SmartEnergy for 6 years. While Maryland won the case, consumers lost $7 million in overpayments.
Rate payer-funded PSC labor to run a PSC Consumer Affairs Division supplier group required to handle the thousands of consumer complaints.
25 years worth of tens of thousands, of PC44 Working Group and RM54 and Public Conference ratepayer-funded PSC labor hours and regulated utility personnel labor hours to manage retail choice since 1999.
The $6 million initial retail energy residential advertising campaign in 2003.
The ratepayer funded Maryland Electric and Gas Choice shopping websites. Cost $525,000.
Since no official state reporting was required until January 2025 via SB1, the gas overpayment estimates are conservative. We will never know the true gas overpayments to regulated default gas rates.